Economic Impact of Defense Spending

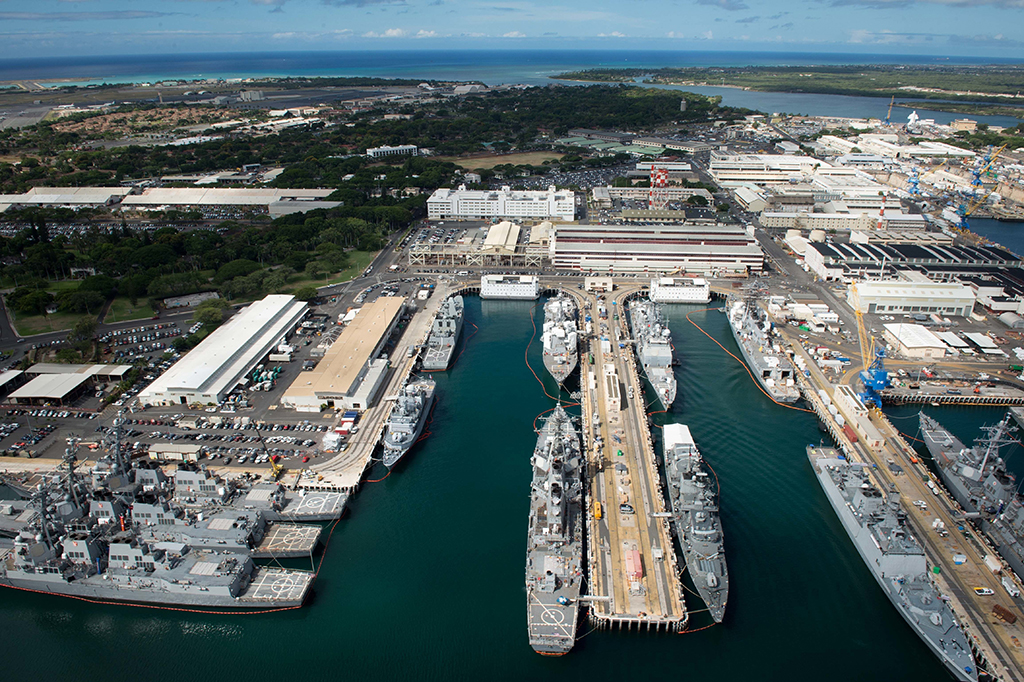
In addition to its strategic importance, defense spending in Hawaii is a vital part of the state’s economy. From jobs for civilians and contracts for local businesses, to spending by active duty military personnel deployed in Hawaii and their families, the defense industry is the second largest industry segment in Hawaii, following tourism.
According to the U.S. Department of Defense Office of Economic Adjustment (OEA), Hawaii ranks #2 in the United States for the highest defense spending as a share of state GDP, indicating increased vulnerability to significant DoD spending changes.
The defense industry is extremely important for Hawaii and our economy. It is the second largest economic driver for the state and generates millions of dollars in contracts for local businesses. We are proud to support the military through the Military Affairs Council.
Defense related personnel spending is the largest defense segment. Spending from products and services accounts for roughly $2B annually and is the focus area of the following data tools, which provide more advanced analytical insights into defense spending trends and the related economic impact:
- State/County Spending Summary/Trends
- Top Products & Services (NAICS/PSC)
- Industry Trends
- “What-If” Analysis
- Growth in Special Set Aside Categories
- Sub-Award Flows and Details
- Leakage Analysis
If you are interested in searching for spending related to specific businesses or awarding agencies, please visit our Spending Insights page.
Data Analysis Tool – State/ County Spending Summary/ Trends
This interactive report provides a summary of estimated spending (prime/ assistance contracts and reported sub-contract/ sub-grant awards), jobs, and economic output for the most recent 12 months. It also provides the % of DoD Dependency using estimated DoD jobs (not including DoD active, reserve, or civilian personnel) divided by total employment for the county or state. To filter the results, you can click on the county in the mapping interface. You can hover over the county to see summarized information. The bar chart in Box A provides summary annual Net Dollar Flows for each county and the state overall.
Data Analysis Tool – Top Products and Services
This report shows the Net Dollar Flows by year for the Top 25 Product Service Code (PSCs) in Tab 1 and Top 20 two and six-digit North American Industry Classification System (NAICS) codes in Tab 2. In Tab 1, Box A shows Hawaii’s top PSCs for prime contracts only. Use boxes B, C, and D to refine your search to particular years, counties, and awarding sub agencies. In Tab 2, Box A shows Hawaii’s top NAICS codes for contracts and sub-contracts. Select a two-digit NAICS code to view the corresponding Top six-digit NAICS. Use boxes C, D, and E to refine your search.
Data Analysis Tool – Industry Trends
This report shows the amount of spending by six-digit NAICS year-over-year (Box F). Use Boxes A, B, or C to filter on industry categories. Use the slider bar or text boxes in Box D to filter on a range of trend rates estimated for the next 12 months using a 5-year linear regression trend, e.g. minimum % allowable to -5% or 5% to maximum % available. Similarly, use the slider in Box E to select a range of total Net Dollar Flows for the most recent 12-month period, e.g. $50M to maximum value available in slider bar. Box G provides contract details related to filters selected.
Data Analysis Tool – “What-If” Analysis
This report shows the estimated impact on jobs and economic output based on changes in spending. Use the slider in Box A to select a percentage increase/ decrease or enter an exact percentage value in the text box. Use Box B to filter the “What-If” impact related to a specific awarding sub agency. Similarly, Use Boxes C and D to select a specific 3-digit and/ or 6-digit NAICS code to filter the impact of the change on a specific industry.
Data Analysis Tool – Growth in Special Set Aside Categories
This report shows year-over-year trends in the dollar value of set aside contracts. The report can be filtered by category (Box B), sub awarding agency (Box C), and NAICS (Box D). By hovering over the line chart, you can see the dollars obligated per year by category selected.
- Identify suppliers and other sectors at risk in the event of a local company or base closure
- Identify potential new markets for these at-risk firms
- Identify local gaps in the supply chain where a prime contractor is using mainland suppliers
- Help state, local and regional policy makers identify which existing assets, like training and assistance, can be aligned to respond to supply chain issues.

Data Analysis Tool – Sub-Award Relationships
This data tool helps uncover the relationships in the supply chain between the DoD awarding sub agencies, prime contractors, and sub-award organizations. Select an organization in Box B to show the prime and subaward Dollar flows in Box A. Hold the keyboard’s “Ctrl” key down to select more than one organization. Box C can be used to filter on relationship type, e.g. agency to prime (Prime), prime to subcontractor (Sub-Contract or Sub-Grant). Note: This data tool only shows prime contractor self-reported data from USASpending.gov. It does not include all Hawaii prime contract awards. The sub award data is a small, but important subset of the overall spending.
Data Analysis Tool – Sub-Award Contract Details
This data tool shows more details about specific prime awardees and their subcontracts. Choose a prime contractor from Box A or D (Source) to filter the subcontract details in Box E, which include amount, subcontractor (Destination), year, and place of performance state. Use Box B to filter on a specific year and Box C to filter on a specific state where the subcontract is being performed.
Data Analysis Tool – Subcontract Flows Out of Hawaii
This report shows total subcontract dollars flowing into and out of the state (Leakage) over the last 12 months in the first two text boxes, followed by the difference between the flows (Net Sub Flow) in the third box. The last two boxes provide an estimate of net jobs and economic output resulting from the Net Sub Flow. Use the TreeMap in Box A to select a state to view the specific six-digit NAICS codes in Box B and contract details in Box E related to the out-of-state flows. Alternatively, select a NAICS code in Box B to see the related states in Box A and contract details in Box E. Box C provides an annual view of net subcontractor flows, and Box D identifies the Top 5 prime contractors with the highest flows out of the state.
